


There’s a particular kind of silence that hangs over a lab at 11:47 p.m.—the hum of incubators, the glow of a plate reader, and a scientist staring down yet another export named “final_v7_reallyfinal.xlsx.” A sponsor wants early-stage results by morning, but the data is scattered across file shares, device PCs, and email threads. In the world of contract development and manufacturing, the work is complex, the timelines are unforgiving, and the difference between “we think” and “we know” determines trust.
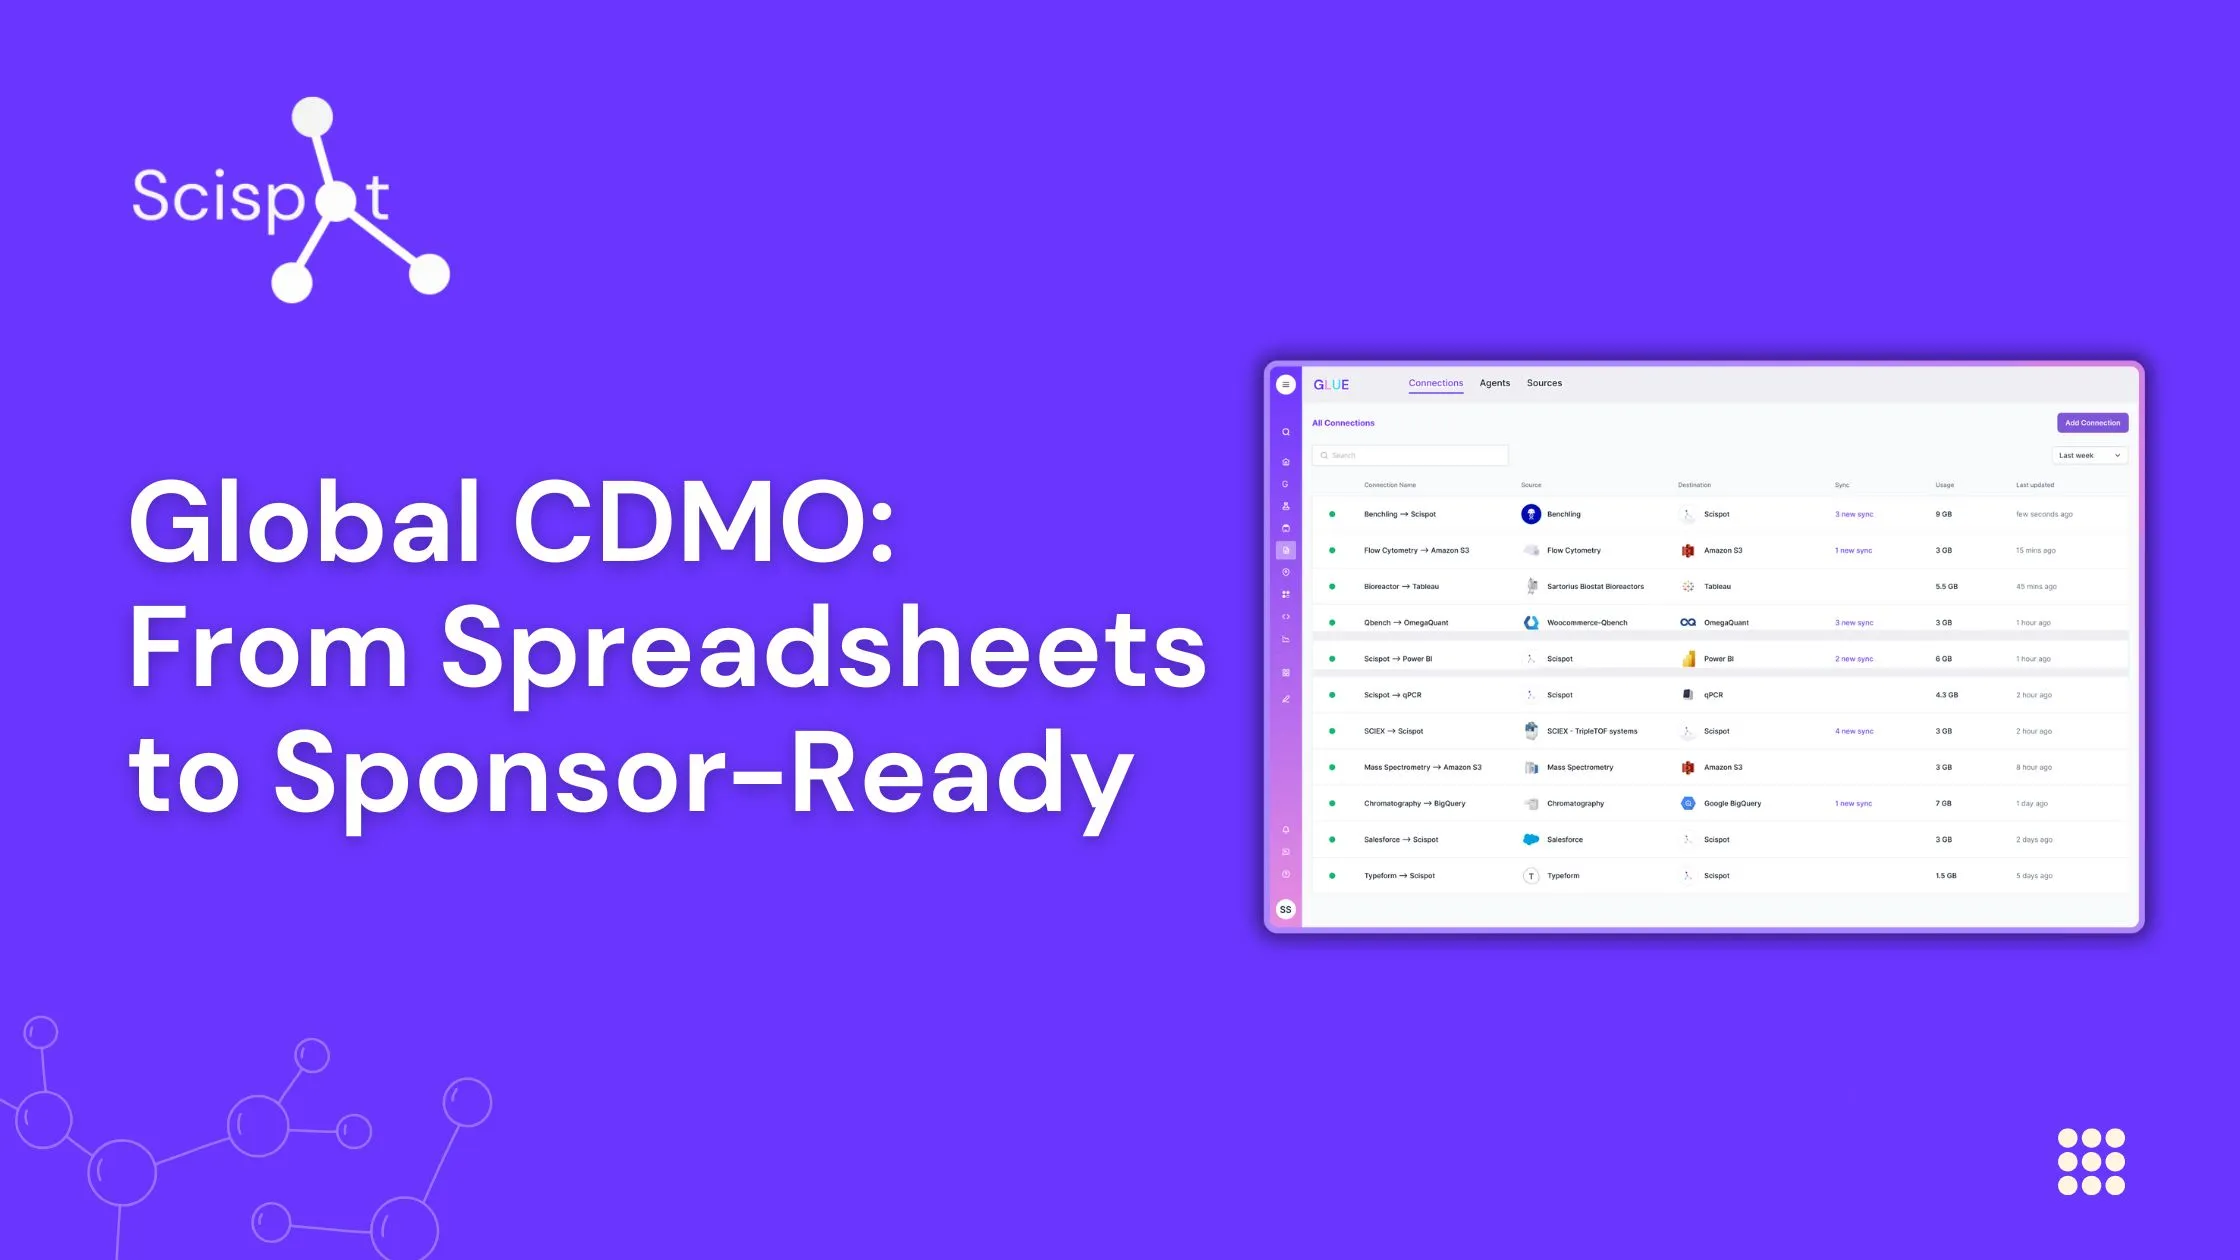
One of the world’s leading CDMOs decided to rewrite that story. They asked a simple question that cut through the noise: what if every sample, every well, every run, and every decision lived in one place—traceable, standardized, and instantly shareable? That question led them to Scispot.
From the first discovery call, it was clear the problem wasn’t a lack of instruments or talent. The organization was already exceptional: Clinical & Early‑Stage Services (CES) churning through micro‑volume reads and identity checks; Upstream (USP) watching viability and growth curves; Downstream (DSP) dialing in purification while tracking impurity clearance; and an Analysis team turning biosensor curves into insight. The bottleneck wasn’t the science—it was the sprawl. Plate maps looked different lab to lab. File naming depended on who was on shift. Method versions were typed into comments. ELISA curves were trusted, but their lineage lived in someone’s head. The work was heroic; the system, brittle.
Scispot entered as the quiet connective tissue. Instead of ripping and replacing what worked, the platform standardized how data moved, how it was interpreted, and how it was proven. The CDMO began with two simple commitments: results must be sponsor‑ready on first pass, and no scientist should have to be a part‑time data wrangler to make that happen.

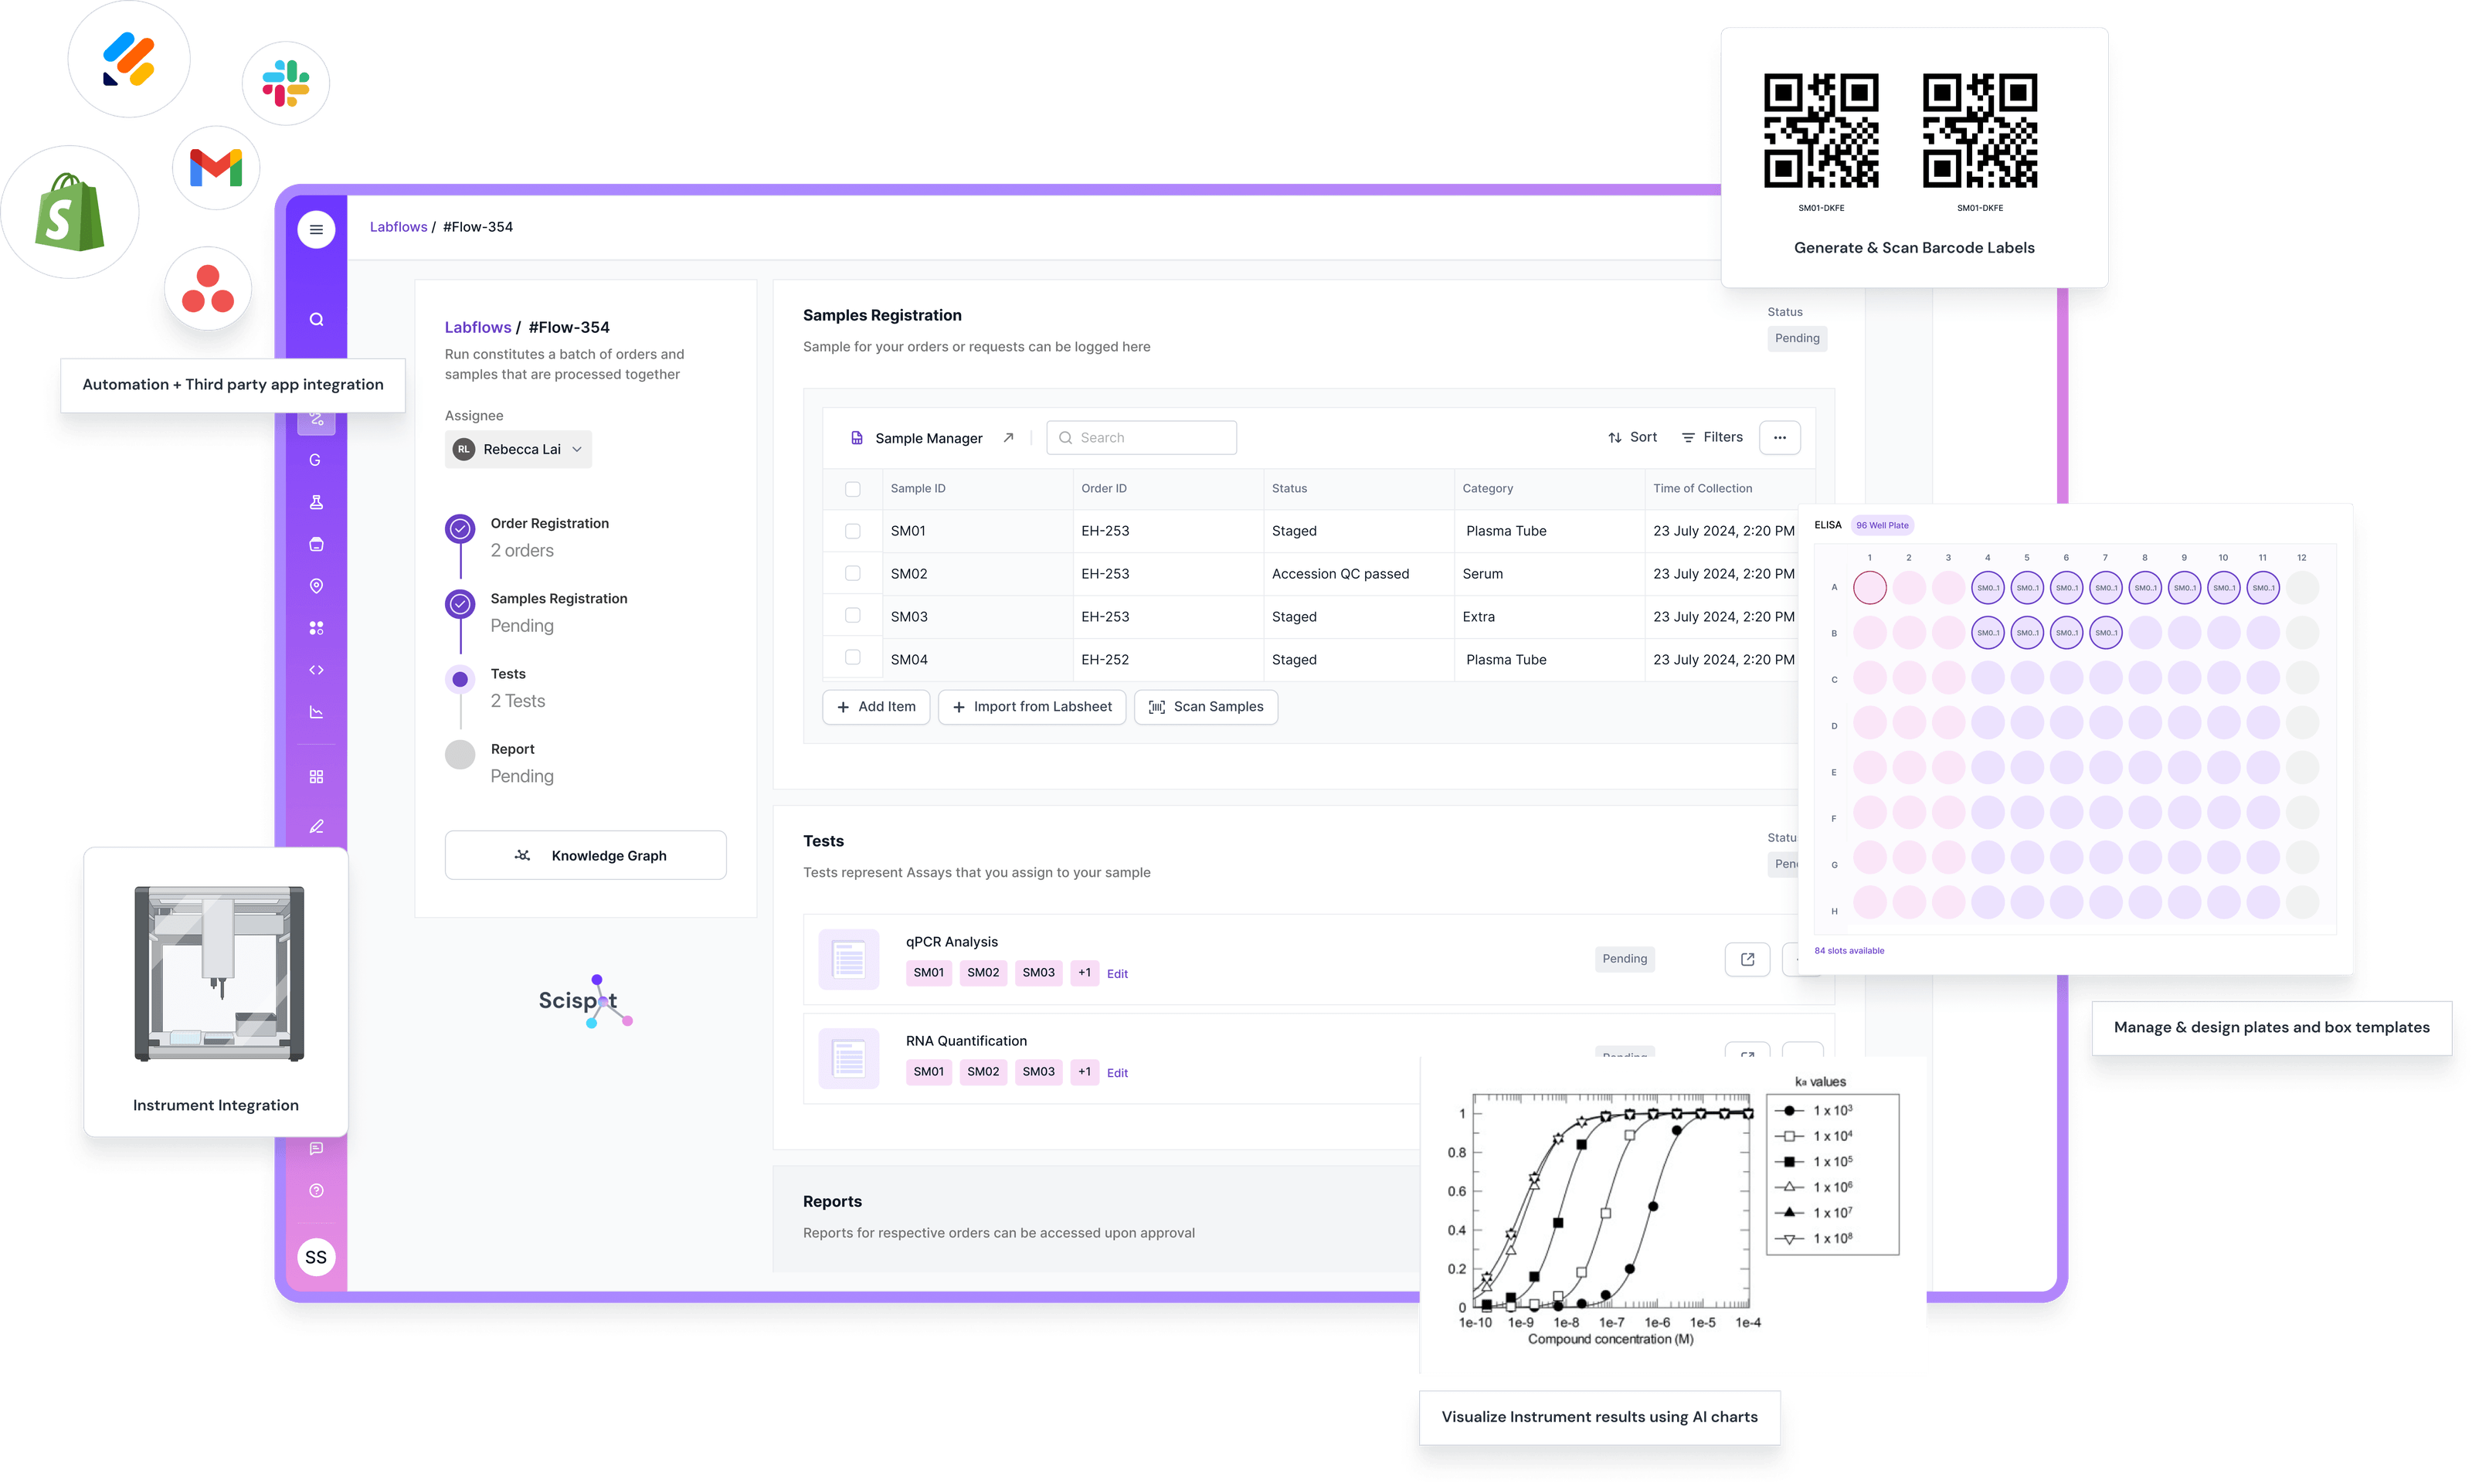
The first visible change came in CES. Micro‑volume spectrophotometer reads and plate reader outputs stopped emerging as orphaned CSVs and started arriving inside a secure, compliant data backbone. The platform mapped each run to a universal schema—Sample, Plate, Well, Assay Run, Result, Instrument, Method—so nothing was ever divorced from its context. Pathlength corrections and purity ratios (like 260/280 at CES and 280/320 for DSP background correction) were calculated automatically with method‑version awareness. If a background read exceeded a threshold, the result wasn’t buried; it was flagged at the moment of ingest, with the audit trail to back it up.
Upstream felt the shift next. Automated cell counters produced clean, live dashboards showing viability gates and viable cell density trends, tagged to sampling points and bioreactors without manual relabeling. The question “should we harvest?” stopped being a debate and started being a buttoned‑up call made from the same truth everyone could see. For teams that had grown accustomed to hunting for numbers, the relief was palpable.
Downstream gained clarity where it mattered most. ELISA curves came in with built‑in acceptance checks—curve fit quality, back‑calculated standard recovery, LOD/LOQ guardrails—so conversations moved from “is this curve acceptable?” to “what does this mean for release?” Quick screens using dynamic light scattering showed aggregation risks without a separate spreadsheet safari. And when the Analysis team ran biosensor assays, kinetic fits arrived with model notes, fit quality, and residuals, linked to the exact cartridge, buffer, and method version used. The familiar anxiety of “can we defend this in an audit?” gave way to a calmer, better question: “what should we improve next?”
Some of the most meaningful changes were emotional rather than technical. Scientists stopped screenshotting curves to drop into decks and started shipping sponsor‑ready packets generated from the system itself—clean tables, readable PDFs, the original instrument files, and the calculated fields that told the real story. Program managers who once lived in their inbox found themselves tracking status in a single pane of glass across CES, USP, DSP, and Analysis. Data Ops leads no longer negotiated truce treaties between file formats; they owned a stable contract: APIs in, structured results out, notebooks and dashboards on top.
The “why” of all of this was always bigger than convenience. Sponsors don’t just buy results; they buy predictability, traceability, and confidence that what passed today will pass again tomorrow. By unifying data and decisions, the CDMO earned something that doesn’t show up on a Gantt chart—trust. Turnarounds shortened not because people worked harder, but because friction disappeared. First‑pass acceptance climbed because QC stopped being a separate step and started being the way data arrive. And those surprise escalations that used to break a day in half became rare, because outliers were caught at the point of capture.
Scispot’s “how” stayed high‑leverage and low‑drama. The platform served as a secure, compliant hub that spoke fluent instrument and fluent science. Plate‑based and non‑plate workflows followed a shared language, so adding a new assay stopped feeling like adding a new planet to the solar system. The integration toolkit let internal teams wire their instruments directly; the same work that once produced static exports now produced living records. Notebook‑native analysis handled curves and overlays without leaving the environment. And because everything was versioned—methods, references, acceptance criteria—the team could update responsibly without losing the thread.
What surprised leadership most wasn’t the dashboards (although those got plenty of attention). It was the operational discipline that emerged naturally once the system stopped playing favorites. When CES set a purity criterion, the number didn’t hide in a slide; it governed reality. When DSP adjusted a background correction rule, every downstream decision inherited it. When Analysis updated a biosensor model, the reasons were documented where the fits lived. In a field that has to be both fast and right, this blend of speed and governance wasn’t a luxury. It was the point.
There’s also a financial truth here that’s easy to miss. The cost of doing work twice is higher than any software subscription. The cost of re‑explaining a result to a sponsor is higher than any onboarding. By removing hunt‑and‑peck labor, reducing re‑measures, and consolidating handoffs, the CDMO won back hours that could be spent on the only work that compounds: improving the process and advancing the program. That’s the quiet compounding interest of good data operations.
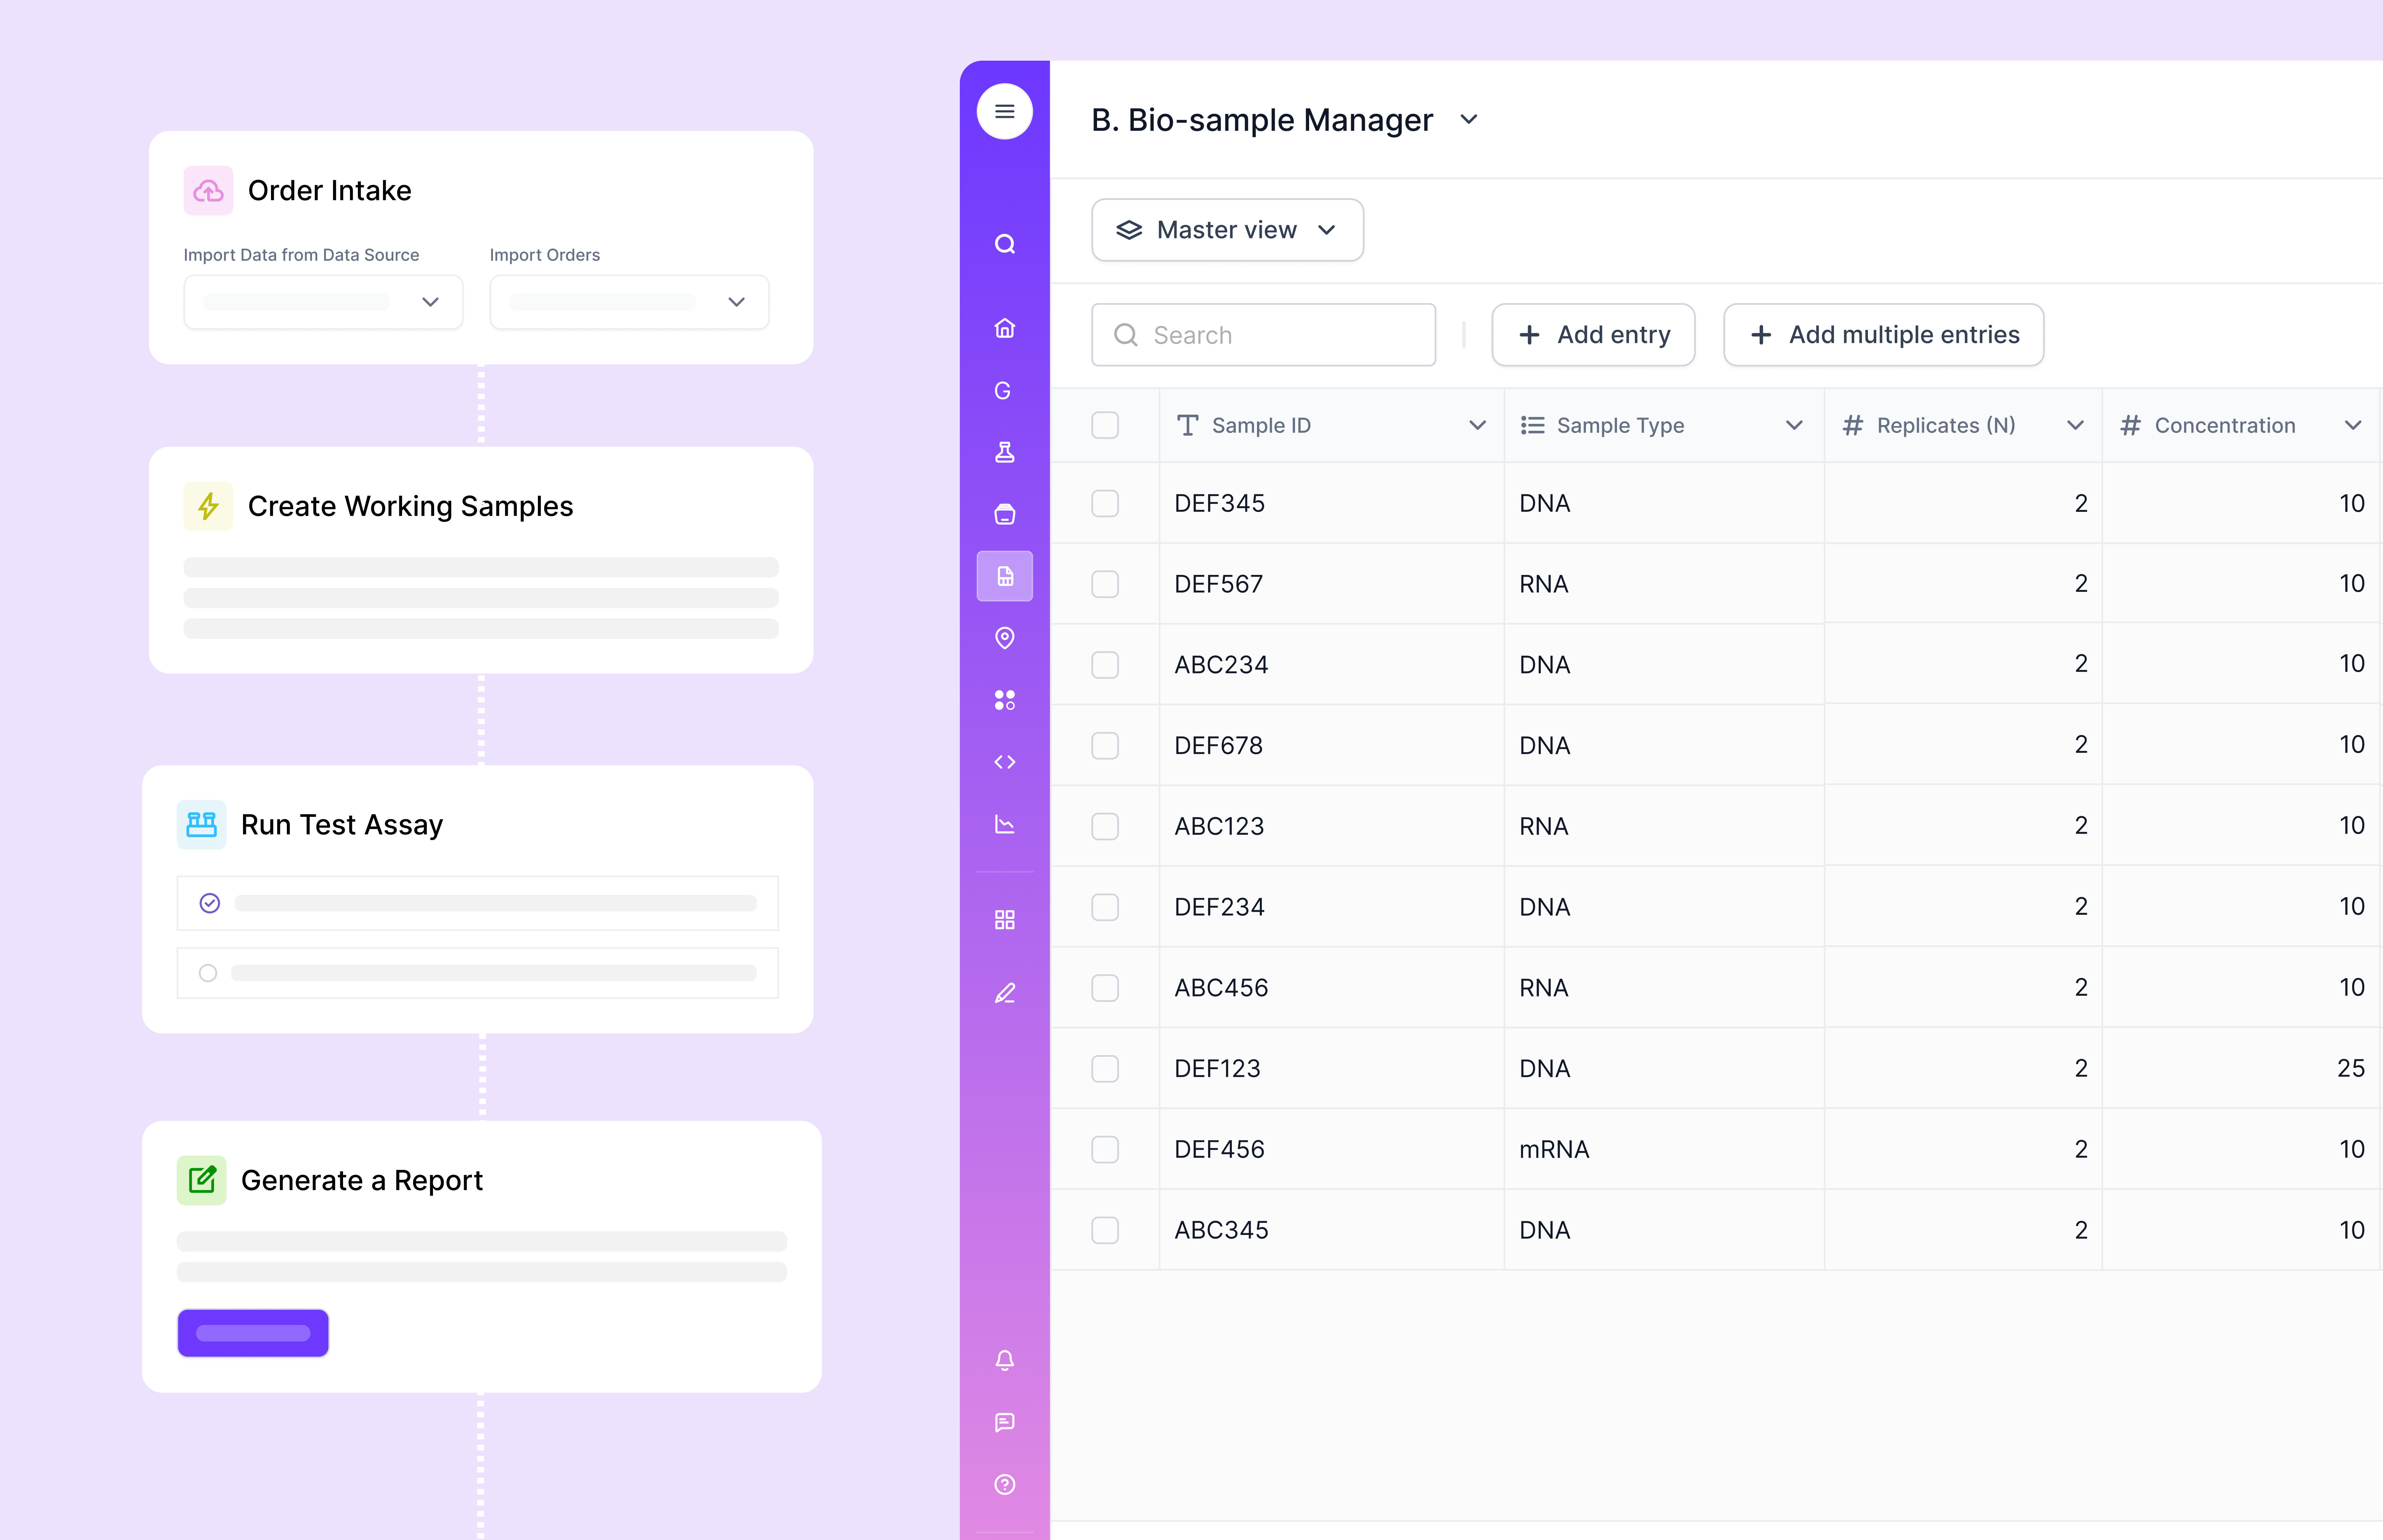
Today, a typical day looks different. A shipment arrives; samples are scanned and auto‑contextualized. Methods are selected from a curated library rather than recreated from memory. Instruments stream outputs directly into structured records. Acceptance checks run on ingest. Outliers are surfaced rather than discovered late. Results are assembled into a sponsor‑ready packet with a single click—data tables, calculations, PDFs, and originals—no midnight heroics required. And when the sponsor asks “can you show us how you got this?”, the answer is not a scavenger hunt. It’s an audit‑ready timeline with the right level of detail.
None of this happened because someone wrote a better SOP in PowerPoint. It happened because the CDMO decided that scientists should do science, analysts should analyze, and leaders should lead—not chase files. Scispot simply made that decision executable.
If you run a CDMO or a scaling biologics organization, the calculus is straightforward. You can keep stitching tools together and hope the handoffs behave, or you can give your teams a platform that turns every assay into a reliable, explainable outcome. In a business where trust is the real currency, choosing the latter isn’t just smart—it’s a no‑brainer.

.webp)


